Project information
- Project Name: Visualization of Hospital Data using Tableau
- Category: Data Visualization
- Client: Bina Nusantara University
- Project date: 8 July, 2023
- Project URL: www.TableAuHospital.com
Tableau-Hospital Portfolio Detail
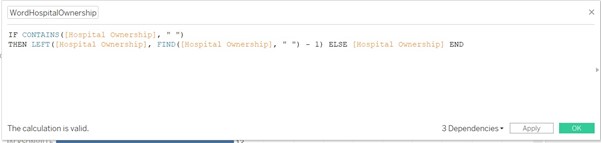
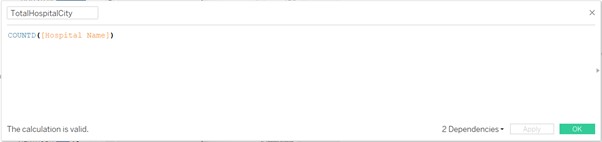
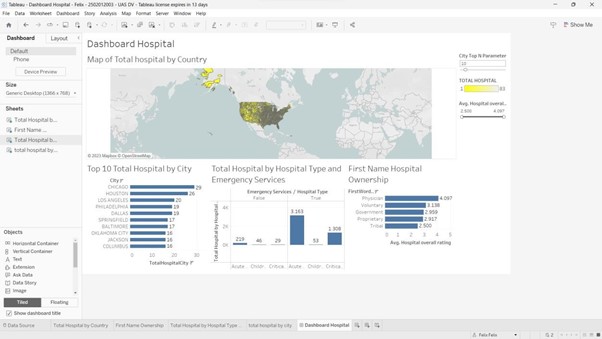
In this Data Visualization project, I utilized Tableau to analyze and present hospital data provided by my university for my final exam in the Data Visualization course. The dataset encompassed various hospital-related metrics, from patient demographics to admission trends. My primary objectives were to explore and clean the data, create interactive visualizations, and extract meaningful insights.
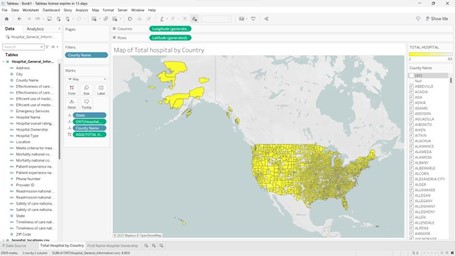
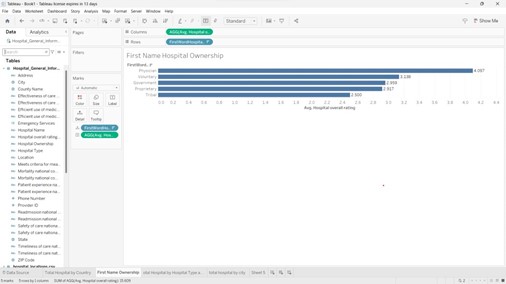
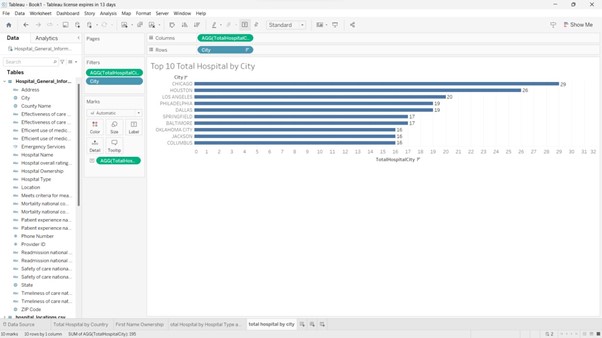
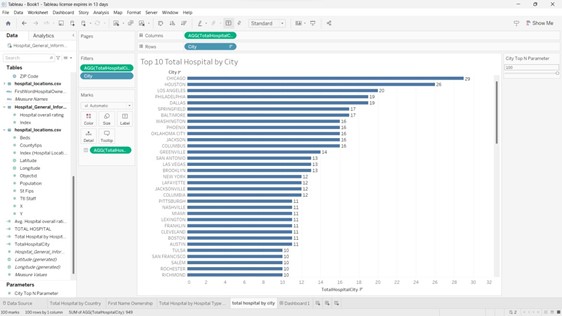
I designed a range of visualizations, including bar charts, flow diagrams, and geographic maps, to effectively convey insights from the data. By identifying key performance indicators and analyzing patient flow, I provided a comprehensive view of hospital operations. The project culminated in an interactive Tableau dashboard that allows users to explore the data dynamically, making it a valuable tool for healthcare professionals and administrators.
This project reinforced my proficiency in Data Visualization principles and demonstrated my ability to transform complex datasets into actionable insights. In the future, I aim to enhance this project with advanced analytical techniques and apply these skills to real-world scenarios to contribute to data-driven decision-making processes in healthcare and other domains.